Metrics from .NET
.NET includes support for collecting metrics in the System.Diagnostics.Metrics namespace. The Open Telemetry SDK integrates with System.Diagnostics.Metrics to read metric values and publish them via Open Telemetry exporters.
Metrics may be sent from .NET applications to Seq by configuring the OpenTelemetry SDK and OTLP exporter.
Configuring the OpenTelemetry SDK
The correct configuration depends upon many factors and is fully documented by the OpenTelemetry project. The following example demonstrates collecting metrics with System.Diagnostics.Metrics, and configuring the OpenTelemetry protocol exporter to send those metrics to Seq.
First, create a new project.
dotnet new console
Then add the OpenTelemetry SDK and exporters.
dotnet add package OpenTelemetry
dotnet add package OpenTelemetry.Exporter.OpenTelemetryProtocol
dotnet add package OpenTelemetry.Exporter.Console
In Program.cs, use System.Diagnostics.Metrics to create a Meter and some Instruments. The meter name will be recorded as the OpenTelemetry scope name (@Scope.name in Seq).
const string meterName = "ExampleAppMeter";
var meter = new Meter(meterName);
var loops = meter.CreateCounter<int>("loop.count");
var loopLatency = meter.CreateHistogram<double>("loop.latency", "ms");
Use the instruments to collect some values. The loops counter metric counts the number of times around the loop. The loopLatency histogram metric records the numeric distribution of the amount of time elapsed in each loop iteration.
var stopwatch = new Stopwatch();
while (true)
{
    stopwatch.Restart();
    Console.ReadLine();
    stopwatch.Stop();
    loops.Add(1);
    loopLatency.Record(stopwatch.ElapsedMilliseconds);
}
Create and configure an OpenTelemetry meter provider, with console and OTLP exporters. Include any built-in .NET meters (e.g. System.Runtime) you wish to collect. The resource name will be recorded as the OpenTelemetry resource name (@Resource.service.name in Seq).
var meterProvider = Sdk.CreateMeterProviderBuilder()
    .AddMeter(meterName)
    .AddMeter("System.Runtime")
    .SetResourceBuilder(ResourceBuilder.CreateEmpty().AddService("ExampleApp"))
    .AddConsoleExporter()
    .AddOtlpExporter((opt, metricReaderOptions) =>
    {
        opt.Endpoint = new Uri("https://localhost:5341/ingest/otlp/v1/metrics");
        opt.Protocol = OtlpExportProtocol.HttpProtobuf;
        opt.Headers = "X-Seq-ApiKey=abcde12345";
        metricReaderOptions.PeriodicExportingMetricReaderOptions.ExportIntervalMilliseconds = 10_000;
        metricReaderOptions.TemporalityPreference = MetricReaderTemporalityPreference.Delta;
    })
    .Build();
When the application runs it will export metrics to the console, and to Seq every ten seconds. Note that the OTLP exporter is configured to use delta temporality.
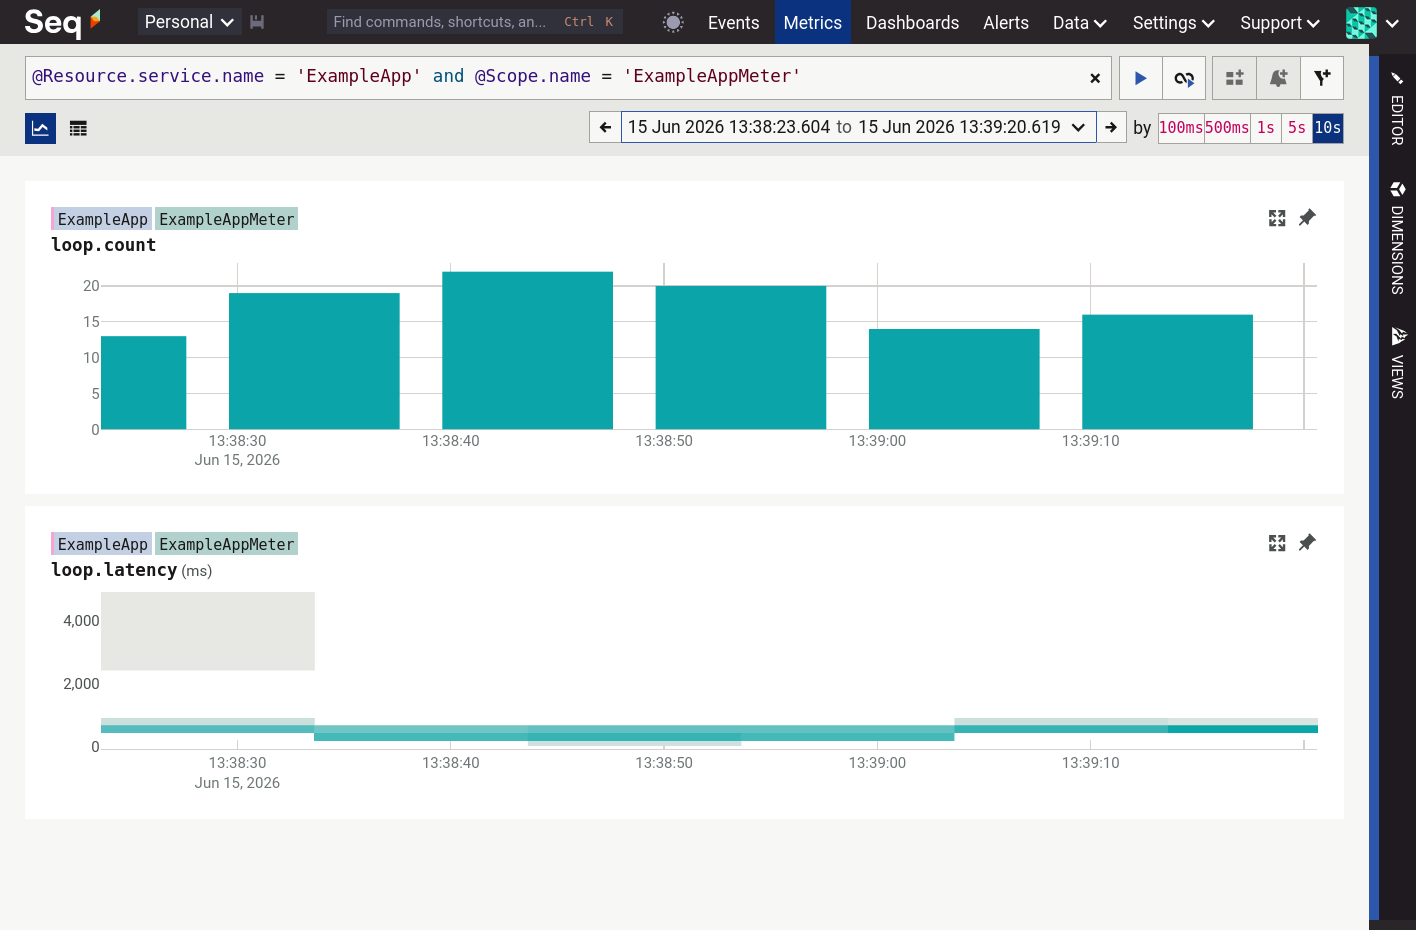
Filtering the Seq metrics page to the ExampleApp service and the ExampleAppMeter scope shows the two custom metrics:
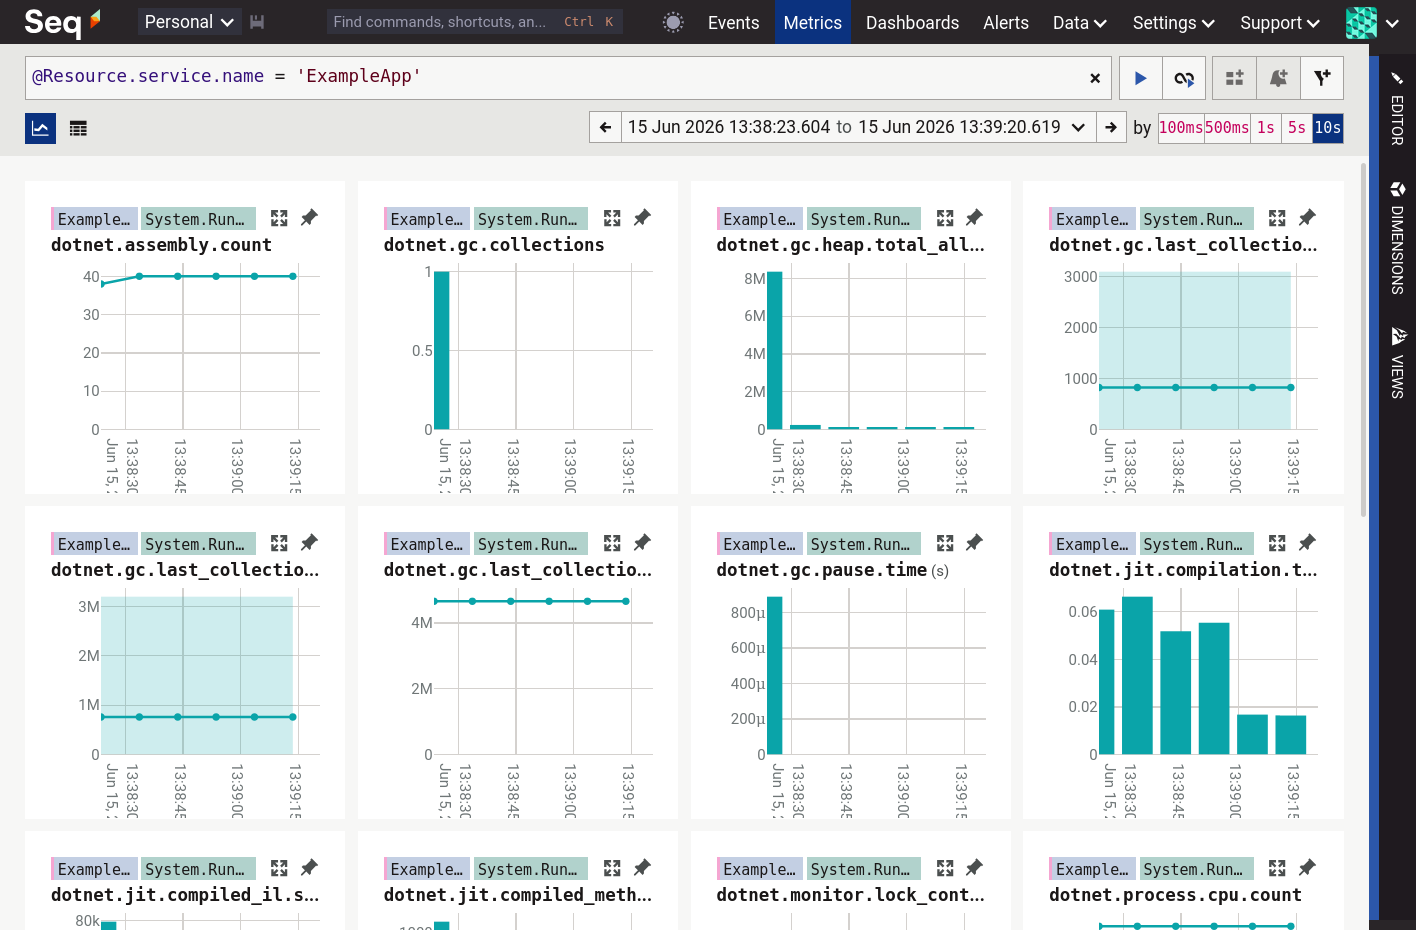
If the @Scope.name filter is removed then the metrics produced by the System.Runtime meter are shown as well.
OTLP endpoints
OpenTelemetry defines three protocol flavors: gRPC, and HTTP with either protobuf or JSON encoding. Seq implements the first two of these; HTTP/JSON is not yet available.
HTTP/protobuf endpoint
Configure your OpenTelemetry metrics source as follows.
| Parameter | Value | Example |
|---|---|---|
| Protocol | http/protobuf |
|
| Endpoint | /ingest/otlp/v1/metrics on any port served by Seq |
https://seq.example.com/ingest/otlp/v1/metrics |
| Headers | Send your Seq API key in X-Seq-ApiKey |
X-Seq-ApiKey: abcd1234 |
gRPC endpoint
If your installation meets the requirements for gRPC configure your OpenTelemetry metrics source with:
| Parameter | Value | Example |
|---|---|---|
| Protocol | grpc |
|
| Endpoint | The HTTPS root URL identifying your Seq server | https://example.com |
| Headers | Send your Seq API key in X-Seq-ApiKey |
X-Seq-ApiKey: abcd1234 |
Aggregation temporality
OpenTelemetry metrics can be configured at the source to send either a running total since an application/service started (cumulative temporality), or the difference since the last sample was taken (delta temporality).
Seq works best with delta temporality
Delta temporality can be configured using the OTLP metrics exporter options:
var meterProvider = Sdk.CreateMeterProviderBuilder()
    .AddOtlpExporter((exporterOptions, metricReaderOptions) =>
    {
        // other exporter configuration here
        metricReaderOptions.TemporalityPreference = MetricReaderTemporalityPreference.Delta;
    })
    .Build();
or, with an environment variable:
OTEL_EXPORTER_OTLP_METRICS_TEMPORALITY_PREFERENCE=Delta
Metrics ingested with the incorrect temporality preference are converted to gauges on arrival and will appear as ever-increasing/sawtooth patterns when charted in Seq.