Metrics
High volumes of logs and traces can become difficult to manage on busy systems. Metrics provide a more efficient way to record and analyze numeric telemetry.
Exploring Metrics
Seq's Metrics screen displays metrics using appropriate visualizations.
Searching, time range selection and time grouping work the same way as Events and Dashboards.
Searching
Searching for a value, like the string client, searches for metrics having that value in their name or description.
Searching for a predicate, like business_unit = 'manufacturing' returns only those metrics having an attribute business_unit with the value 'manufacturing'.
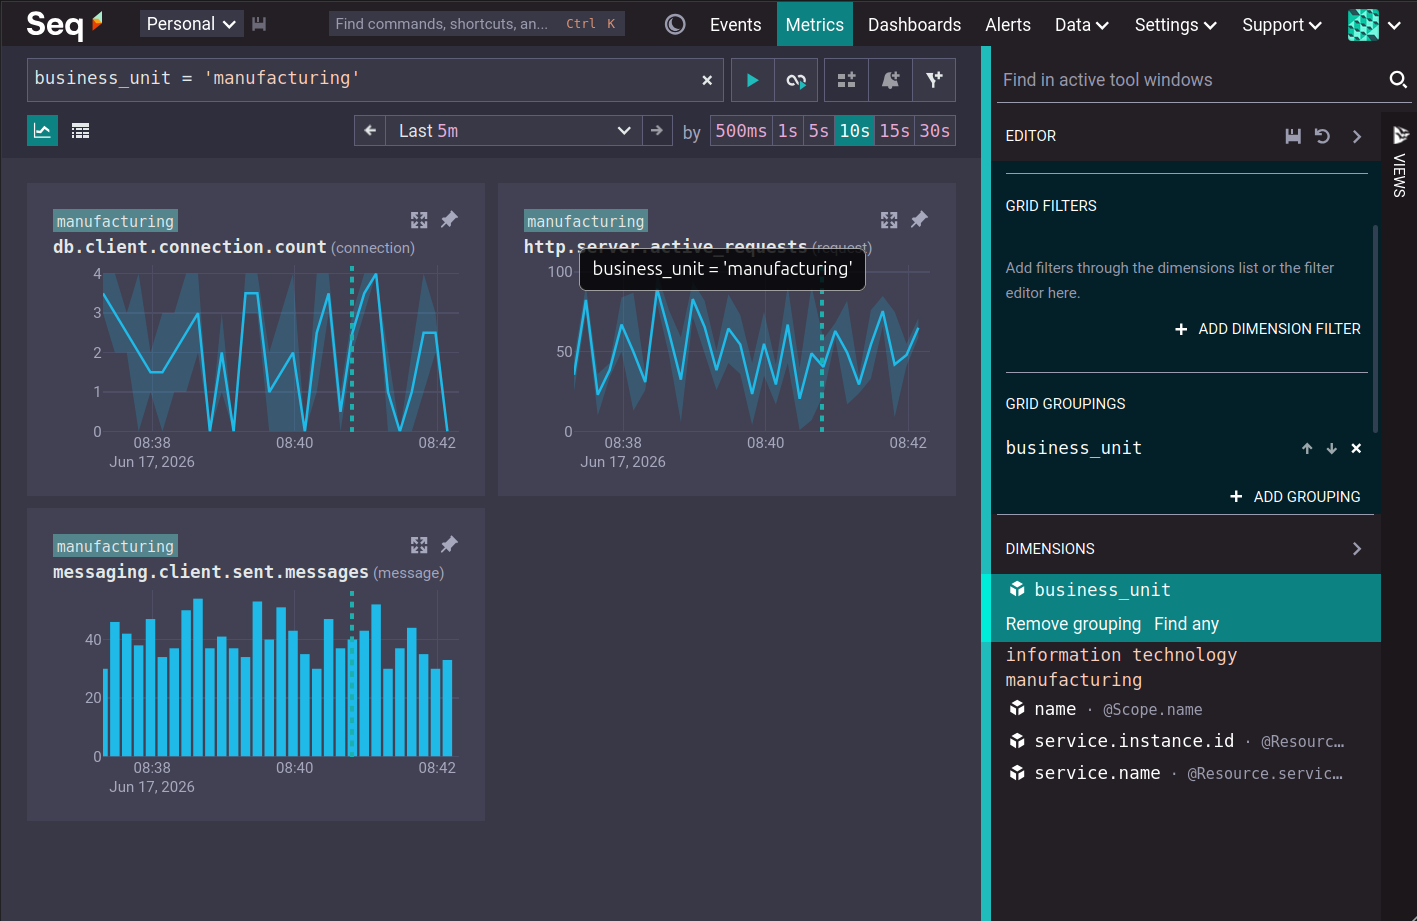
The Add to filter button moves the search expression into the editor, where it can be saved as part of a view.
The Grid View
The grid view displays metrics in a grid. The layout of the grid is configurable, from one column, to nine columns.
The type of visualization used for each chart is chosen based on the metric kind and temporality. Gauges, cumulative sums and cumulative histograms are shown as line charts. Delta sums are shown as bar charts and delta histograms are shown as heatmaps.
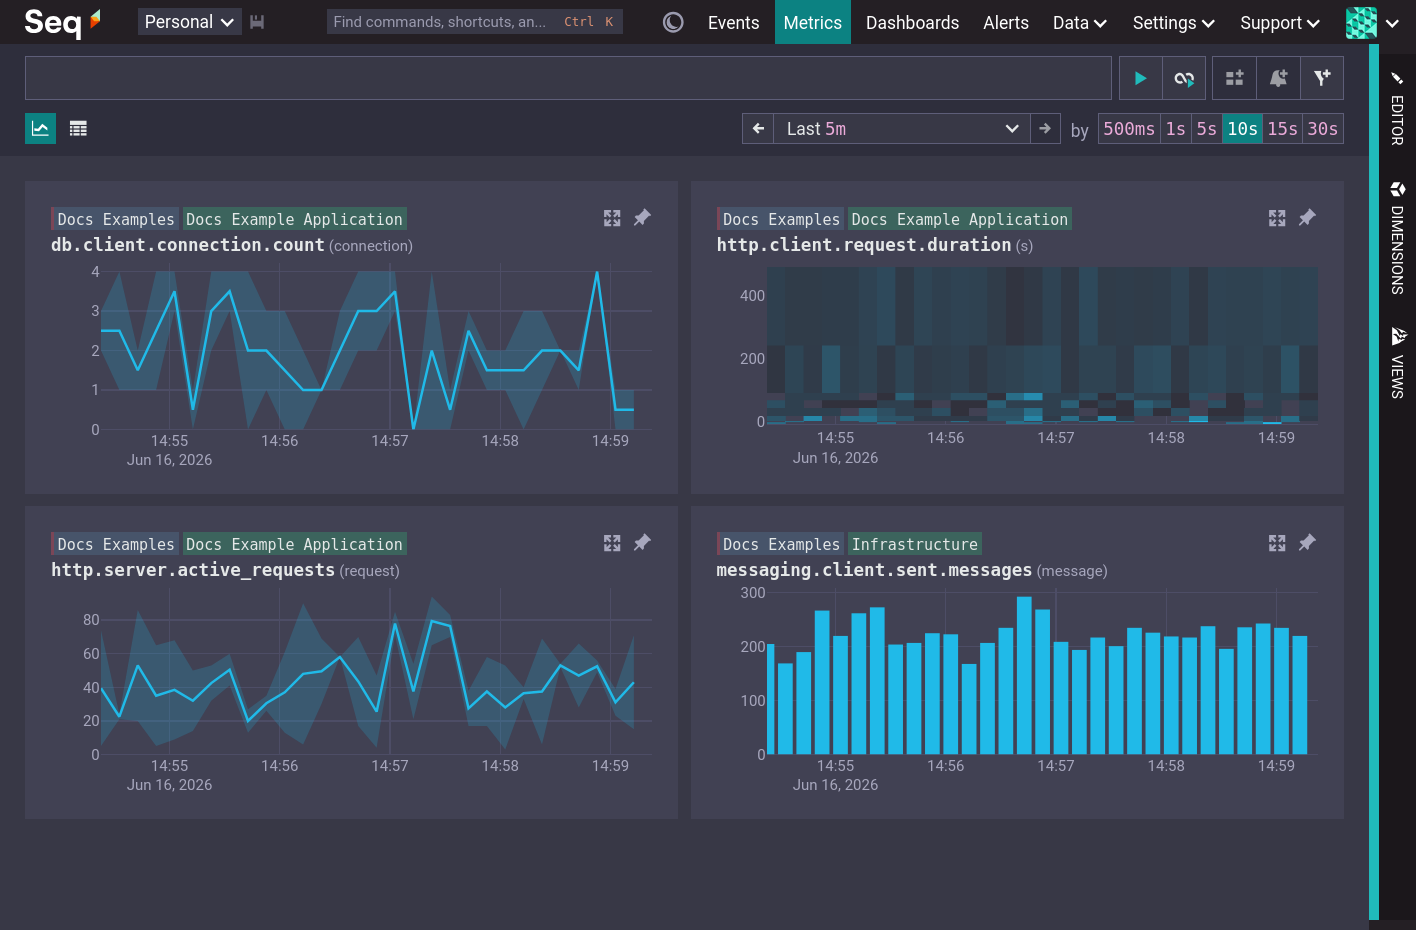
Each chart has a title, which is the metric name, followed by the units of the metric. Above the chart title are the group keys for the current metric groupings. By default, charts are grouped by @Resource.service.name and @Scope.name (see the OpenTelemetry Metrics Model).
In addition to the usual time range selection control it is also possible to select a time range by dragging a selection on any chart.
Pinned Charts
Pinning a chart causes it to be sorted first and freezes its grouping and filtering.
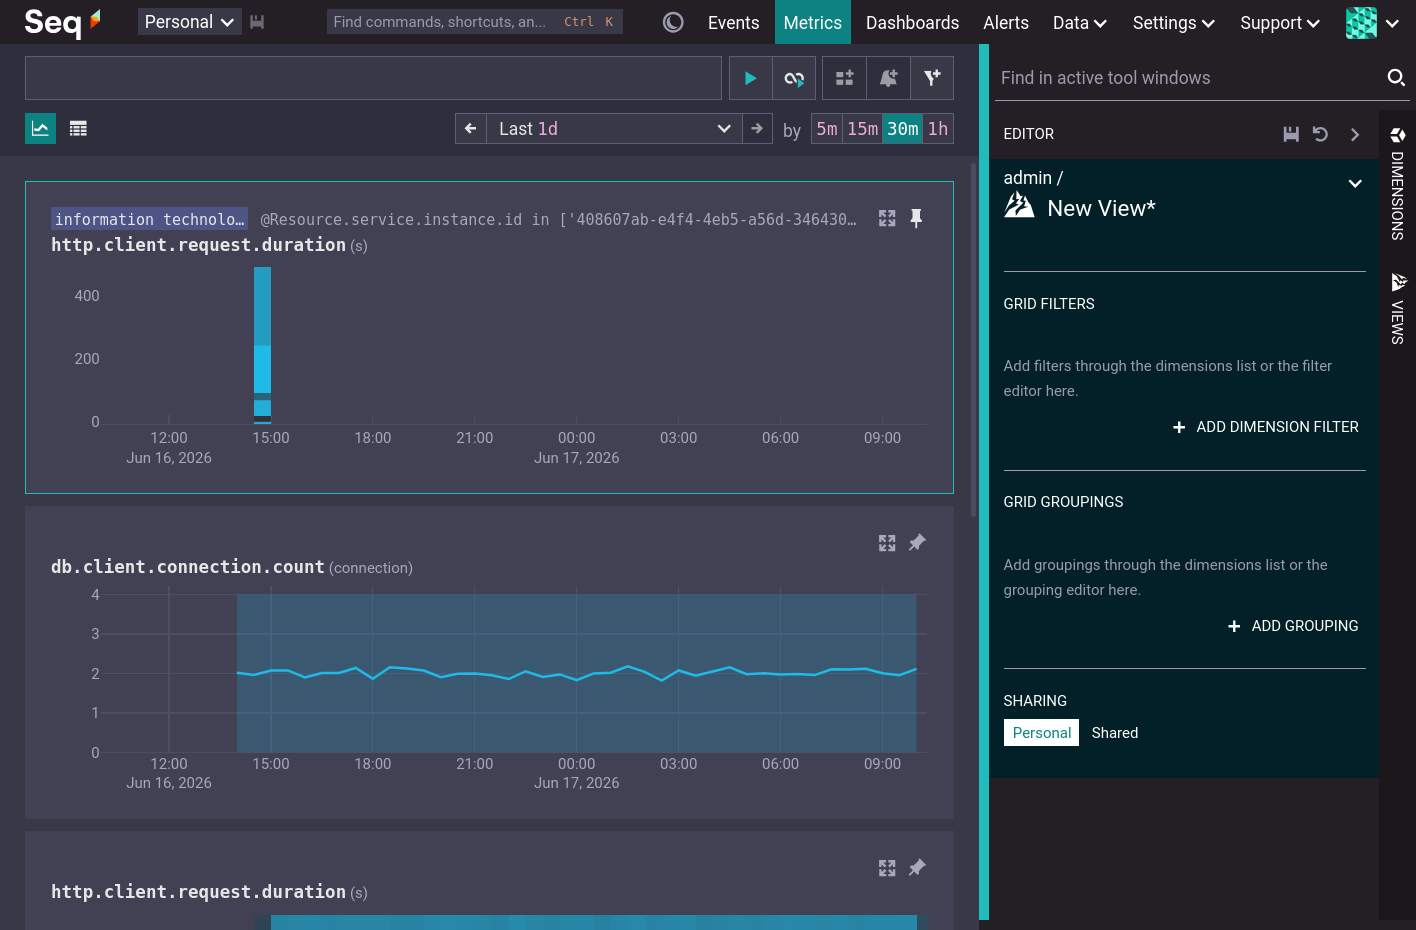
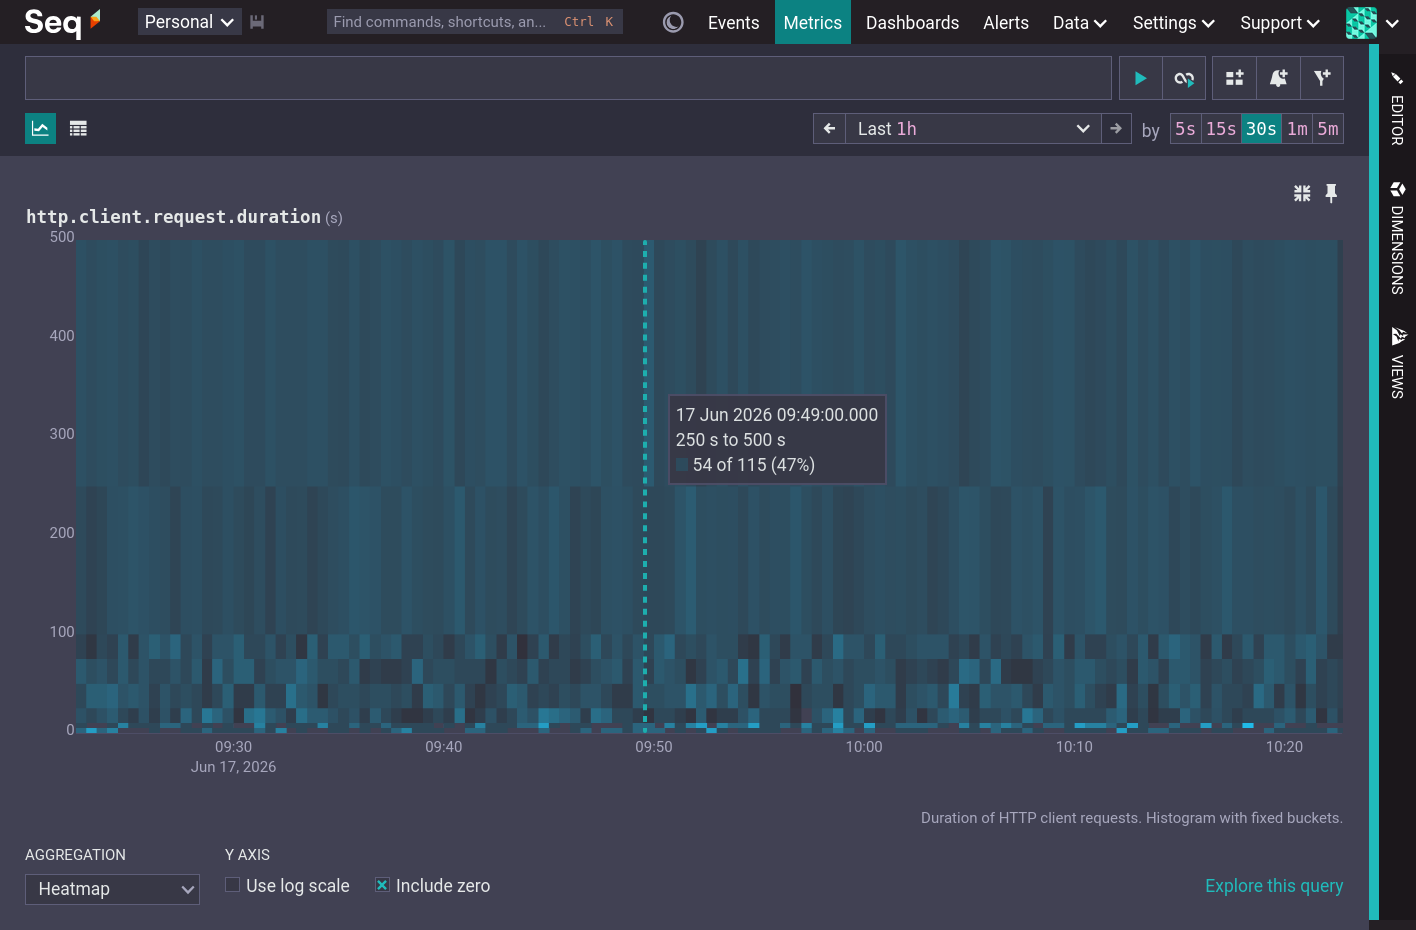
Chart Expansion
Each chart can be expanded to a fullscreen view. Expanded charts show more resolution and allow the chart to be customized. If the chart is customized then it will be pinned when returning to the grid view.
The Table View
Table View is an alternative metrics view that shows the list of metrics in a table, without rendering their charts. Name, unit and description are shown for each metric.
Search, filtering, grouping and pinning work as for the Grid View.
Dimensions
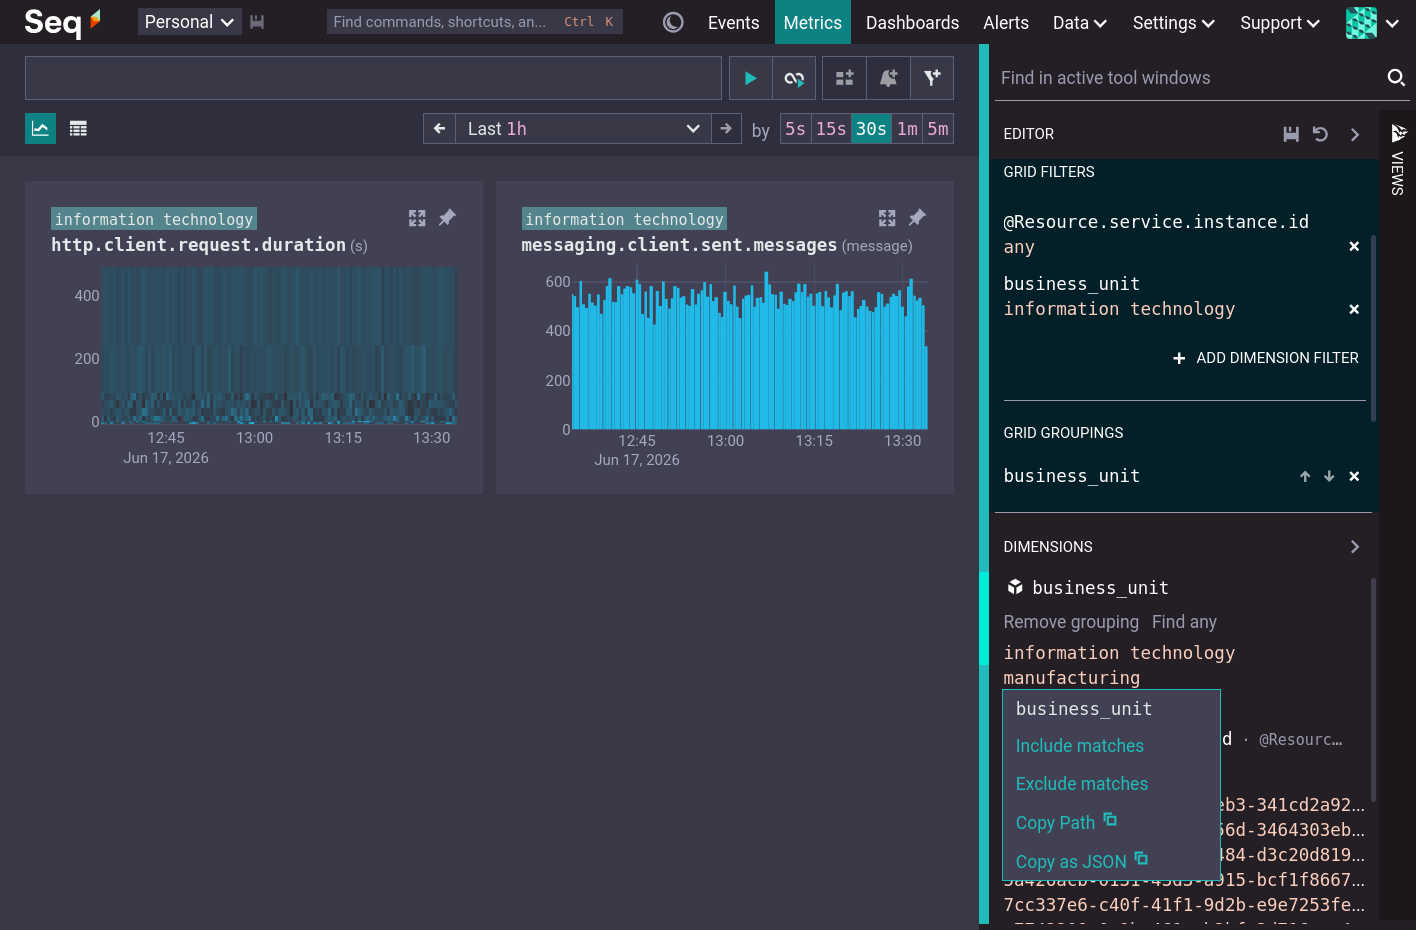
The dimensions toolbar shows all the available metric attributes. Expanding an attribute shows the first fifty values of that attribute. 'Find any' filters to metrics that have a value for that attribute. 'Add grouping' groups the metric search by that attribute.
Click on an attribute value to search for metrics that have that attribute value (Include matches) or that do not have that attribute value (Exclude matches).
Views
A View stores the filtering, grouping and pinned metrics of the Metrics screen. To preserve the setup of the Metrics screen, give the view a name and save it. Choosing a saved view in the Views toolbar restores that view.
Metric Alerts
When a chart is expanded the Create alert button is enabled. Clicking this button populates the New Alert form with the default values for the metric kind. Note that metric alerts select from series instead of stream.
Checking alerts over metrics is typically more efficient than checking alerts over logs or traces.
Metric Dashboards
When a chart is expanded the Add to dashboard button is enabled. Clicking this button adds the metric to a new or existing dashboard.
Dashboards that query metrics are typically more efficient, and faster to load, than dashboards that query logs and traces.
The OpenTelemetry Metrics Model
OpenTelemetry metrics are recorded by interacting with instruments. An instrument is defined by its name, kind, unit, and description.
The OpenTelemetry SDK provides the folliwing instrument kinds:
| Kind | Description |
|---|---|
| Sum | Represents the accumulation of values over time (e.g., counter). It can be monotonic (only goes up, like http.server.active_requests) or non-monotonic (can go up or down, like process.thread.count). |
| Gauge | Represents a sampled value at a specific point in time (e.g., system.memory.usage). It does not imply any aggregation over an interval. |
| Histogram | Encapsulates the statistical distribution of a population of values. It includes the total count, sum, and explicit "buckets" counting how many values fell into specific ranges (e.g., HTTP request latencies). |
| Exponential Histogram | A histogram where bucket boundaries are defined automatically using an exponential scale, allowing high-resolution distribution data with scale configurations instead of manual bucket definitions. |
| Summary | A legacy/compatibility data type designed to represent pre-calculated quantiles (like p95 or p99). It is primarily used to mirror Prometheus or StatsD summaries and is not recommended for new native OTel designs. Not currently supported by Seq. |
When a metric sample is recorded it may have a set of attributes (called labels in Prometheus and tags in .NET) that accompany the metric value. An attribute is a key-value pair. A metric is defined by the combination of an instrument and a particular set of attributes.
Instruments, and thus metrics also have a resource and a scope. A resource is the entity producing the telemetry. A scope is the library or component generating the metrics.
The Seq Metrics Model
Seq stores metric data as a logical ordered set of objects (the series). Each object represents a set of metric samples that share the same timestamp, attributes, resource and scope.
The name, kind, unit, and description of each metric in the object are stored in a built-in property called @Definitions.
The metric value for each sample is stored in a property with the name of the metric.
Properties @Resource and @Scope hold the OpenTelemetry resource and scope data.
All remaining properties are attributes belonging to all the metrics in the object.
Names containing dotted separators are converted into nested objects. E.g. db.client.connection.count is stored as "db": { "client": { "connection": { "count": 2 } } }.
Each object has @Timestamp and @Arrived properties that behave the same as for logs and traces.
Example
Metric samples for db.client.connection.count and http.server.active_requests arriving for the same timestamp and sharing the same business_unit attribute and resource and scope might be represented as the following logical object:
{
  "@Definitions": {
    "db.client.connection.count": {
      "description": "The number of database client connections that are currently active.",
      "kind": "Gauge",
      "unit": "{connection}"
    },
    "http.server.active_requests": {
      "description": "Number of active HTTP server requests.",
      "kind": "Gauge",
      "unit": "{request}"
    }
  },
  "db": {
    "client": {
      "connection": {
        "count": 2
      }
    }
  },
  "http": {
    "server": {
      "active_requests": 7
    }
  },
  "business_unit": "manufacturing",
  "@Resource": {
    "service": {
      "name": "Docs Examples"
    }
  },
  "@Scope": {
    "name": "Docs Example Application"
  },
  "@Timestamp": 639171675119871700,
  "@Arrived": 1
}